East Bench Salt Lake City Homes for Sale
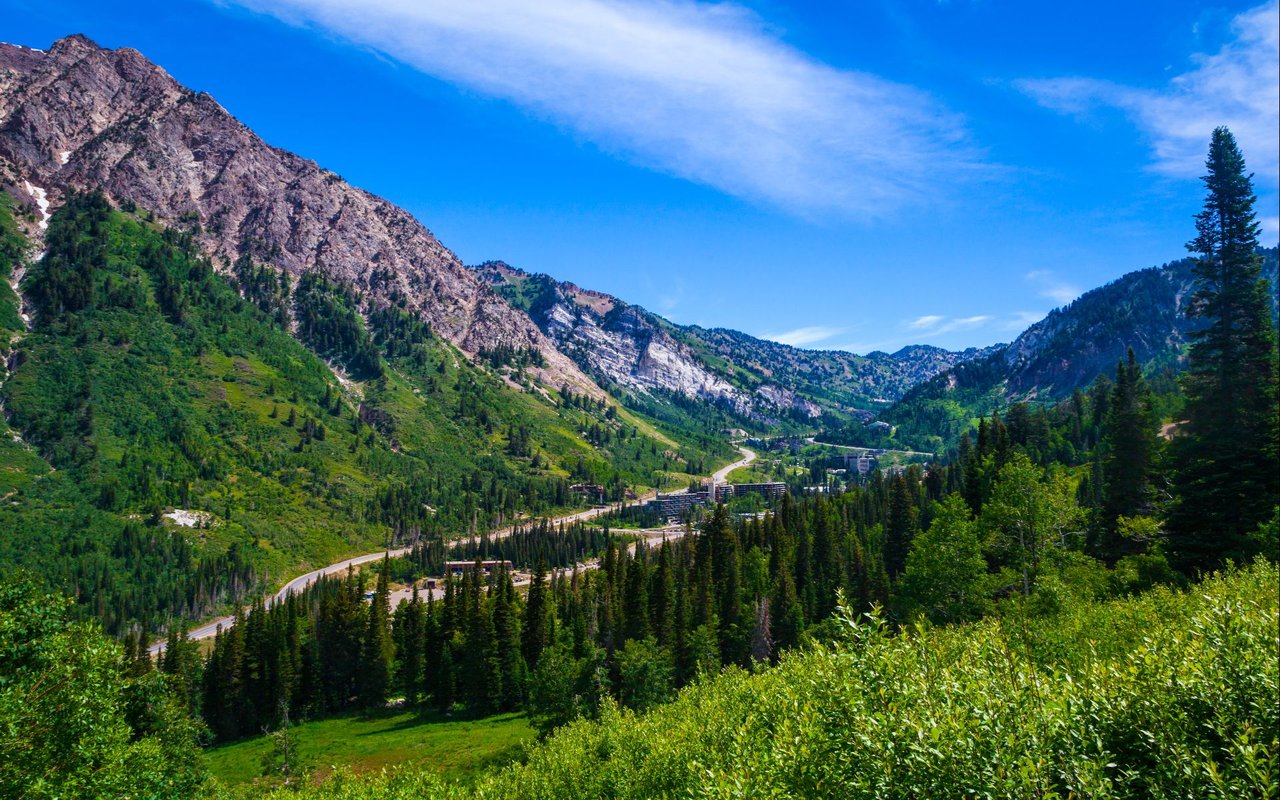
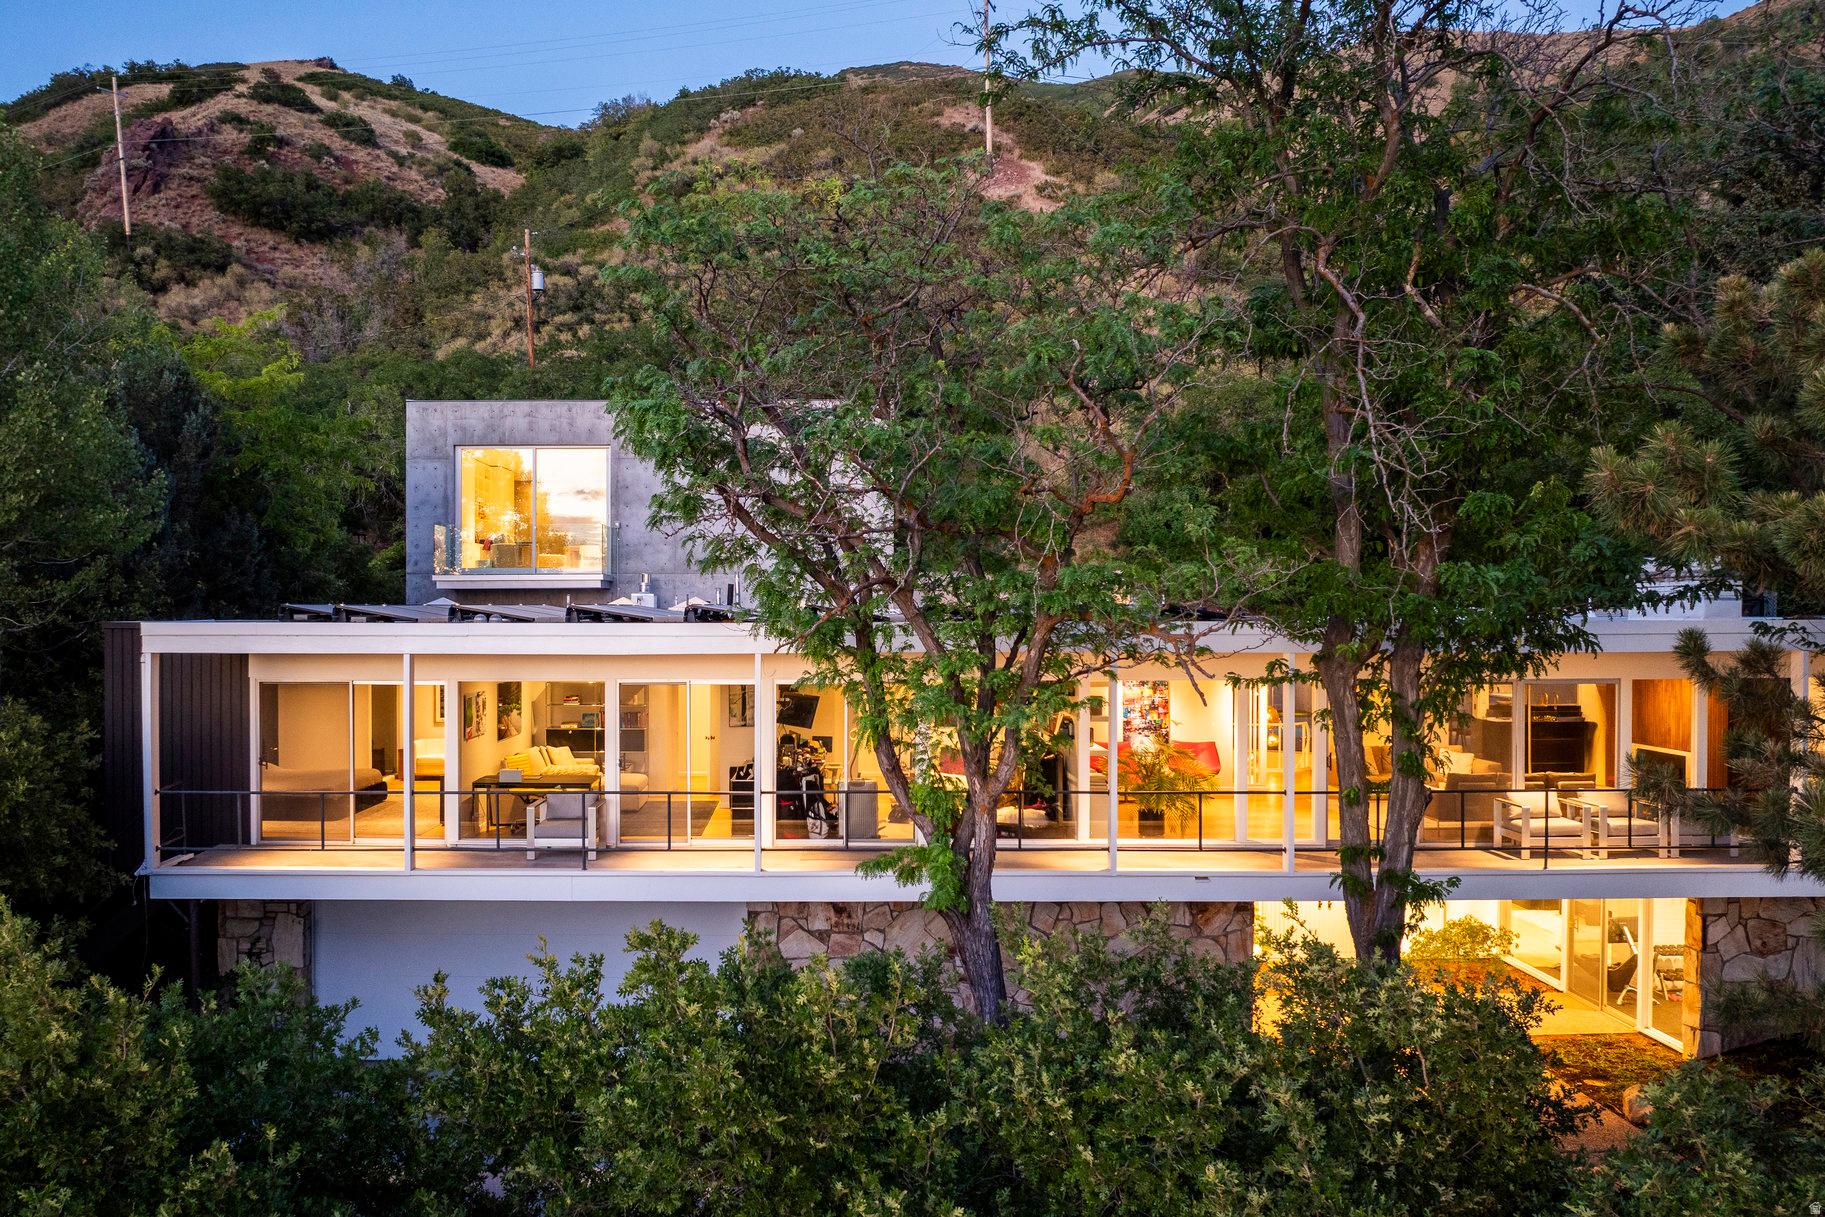
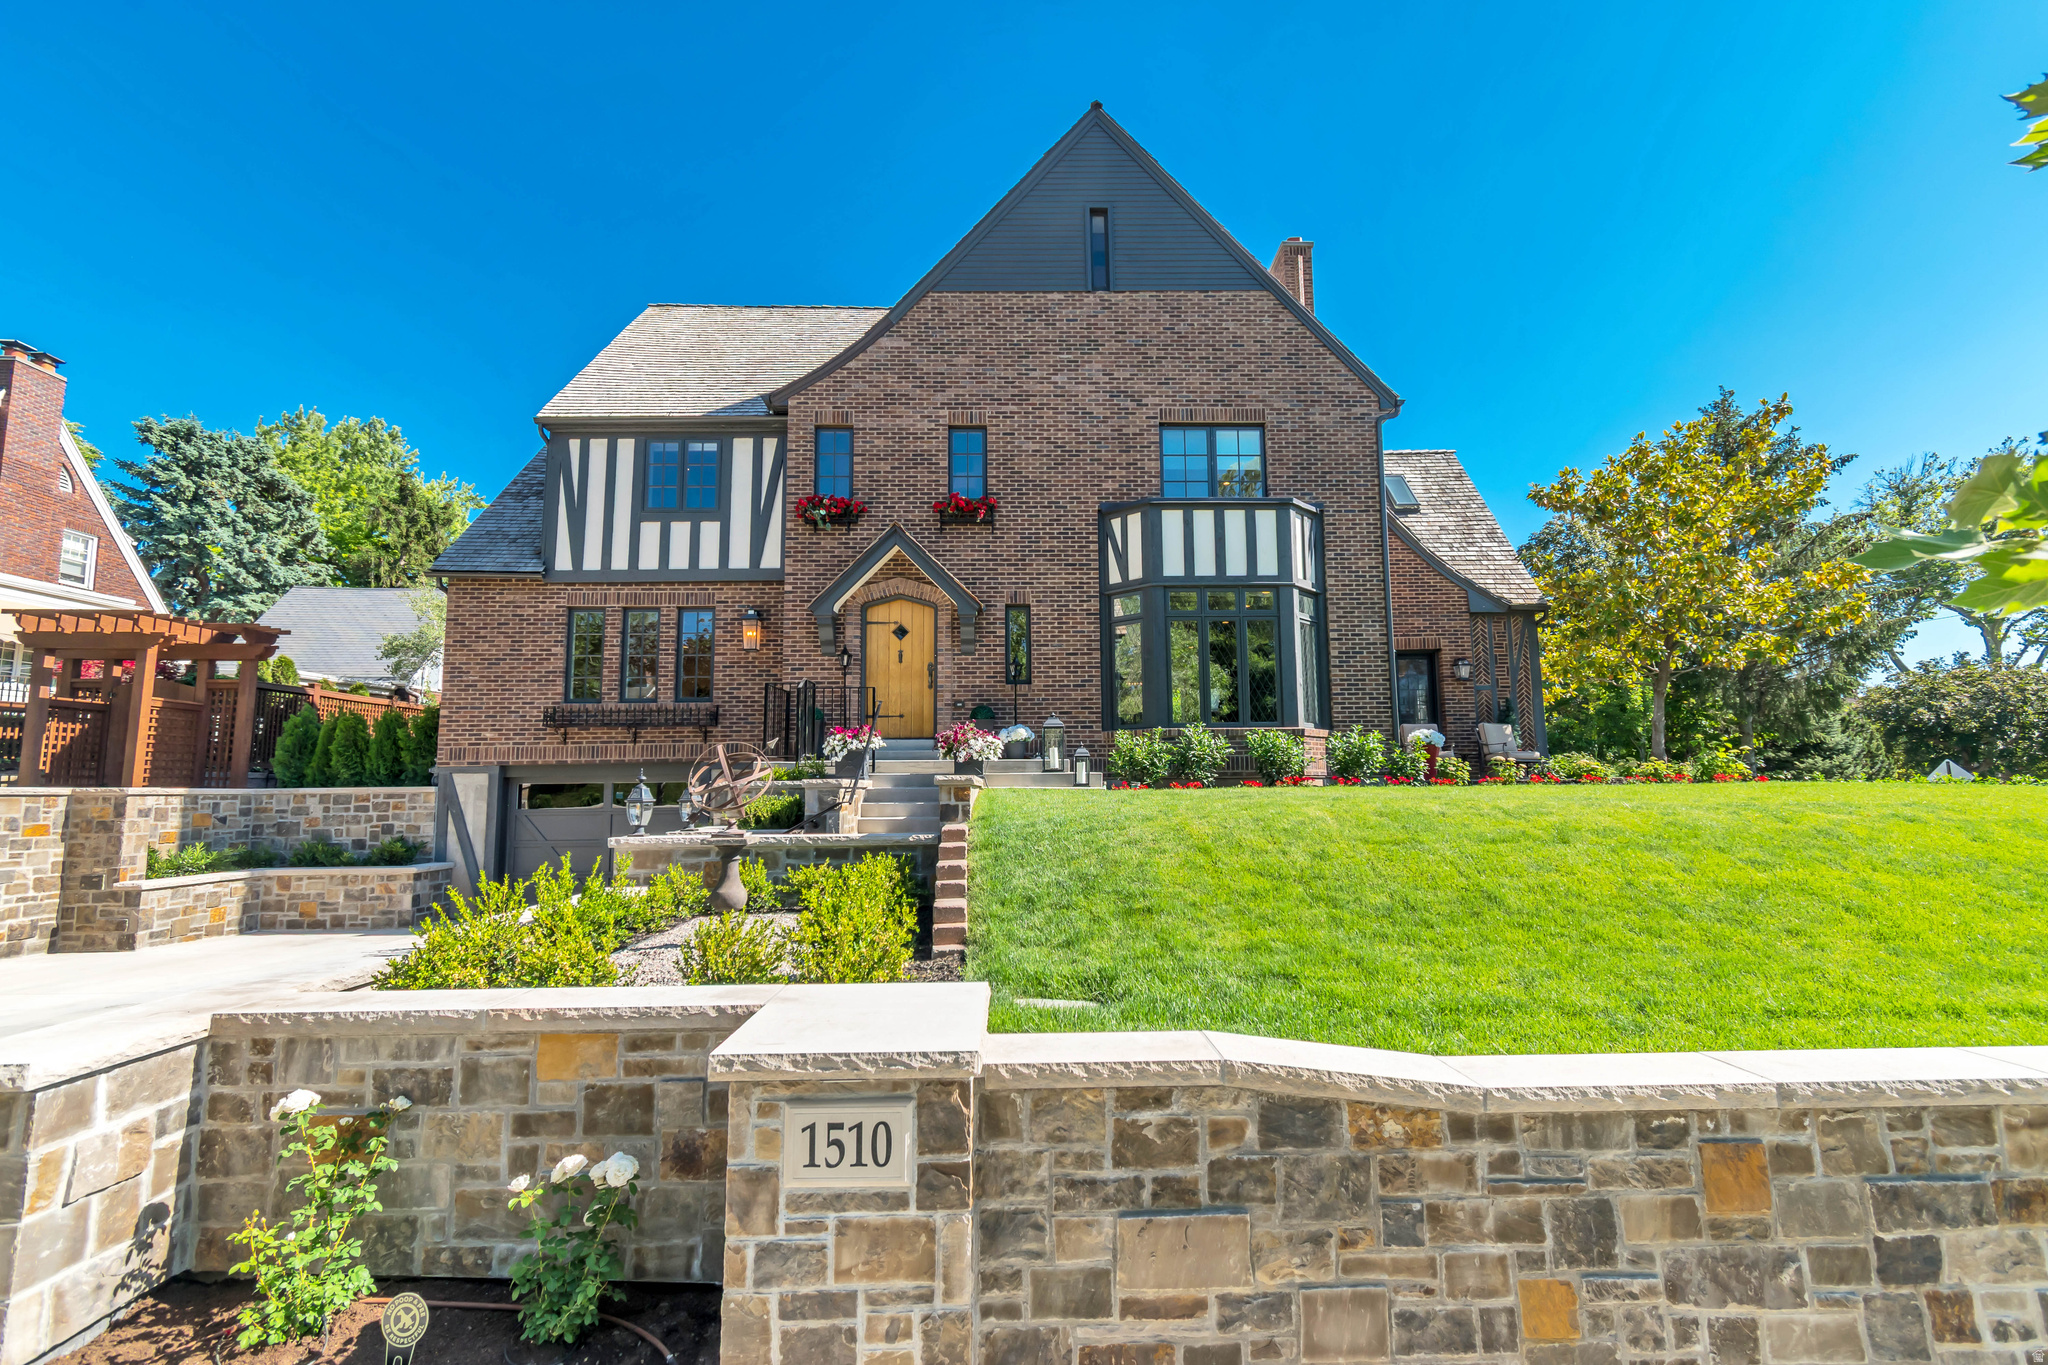
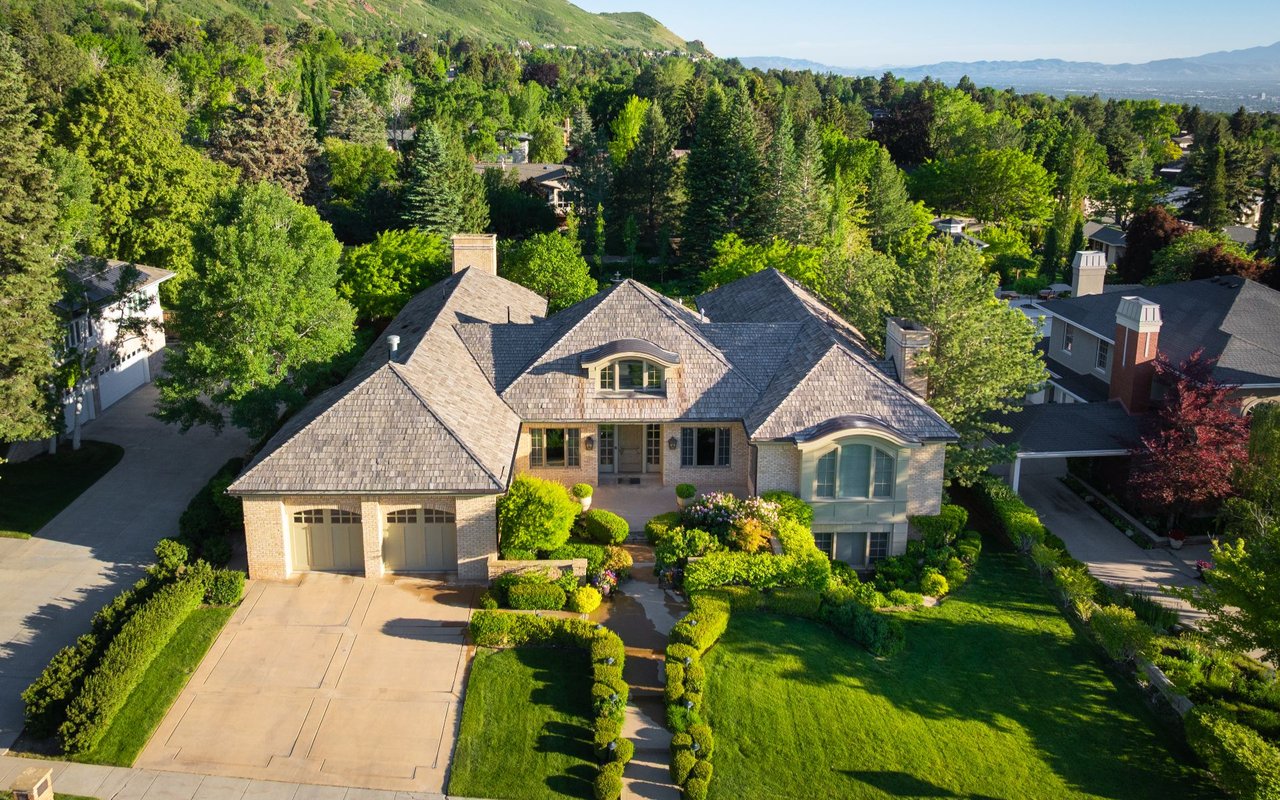
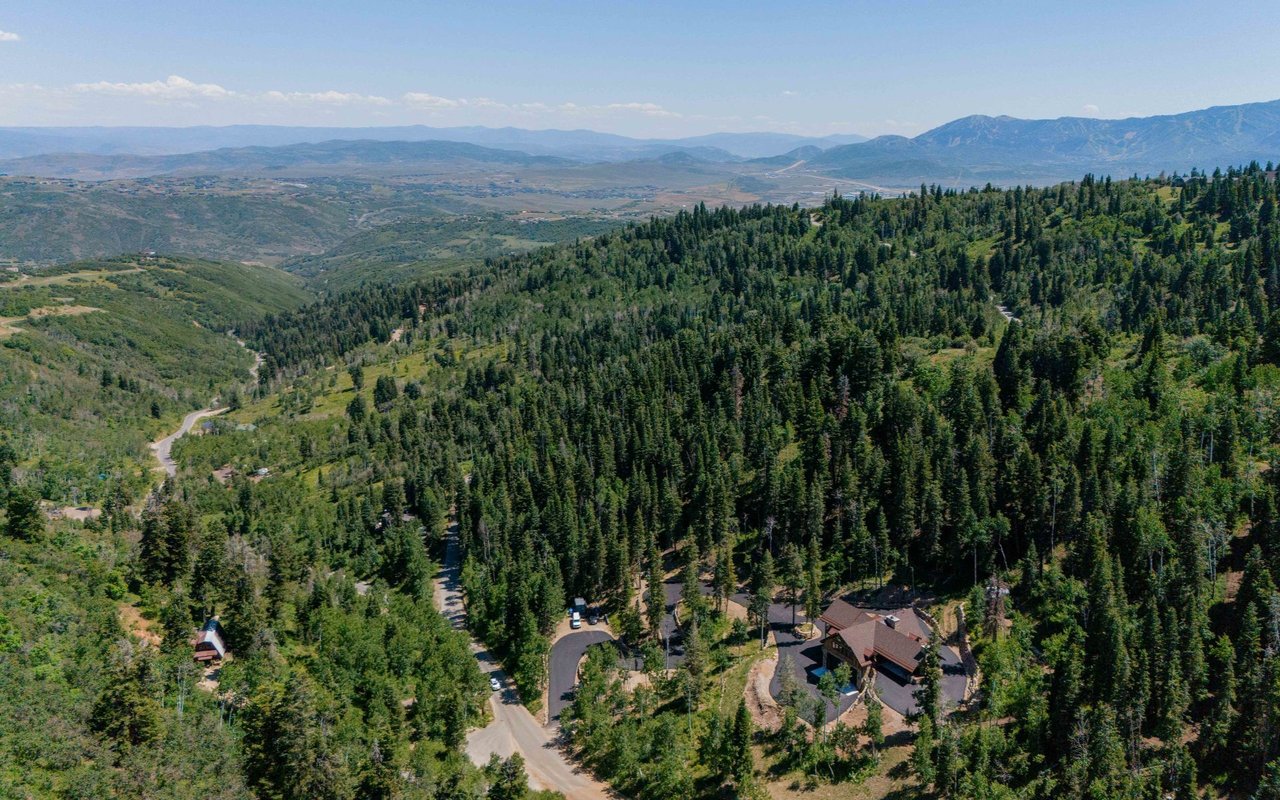
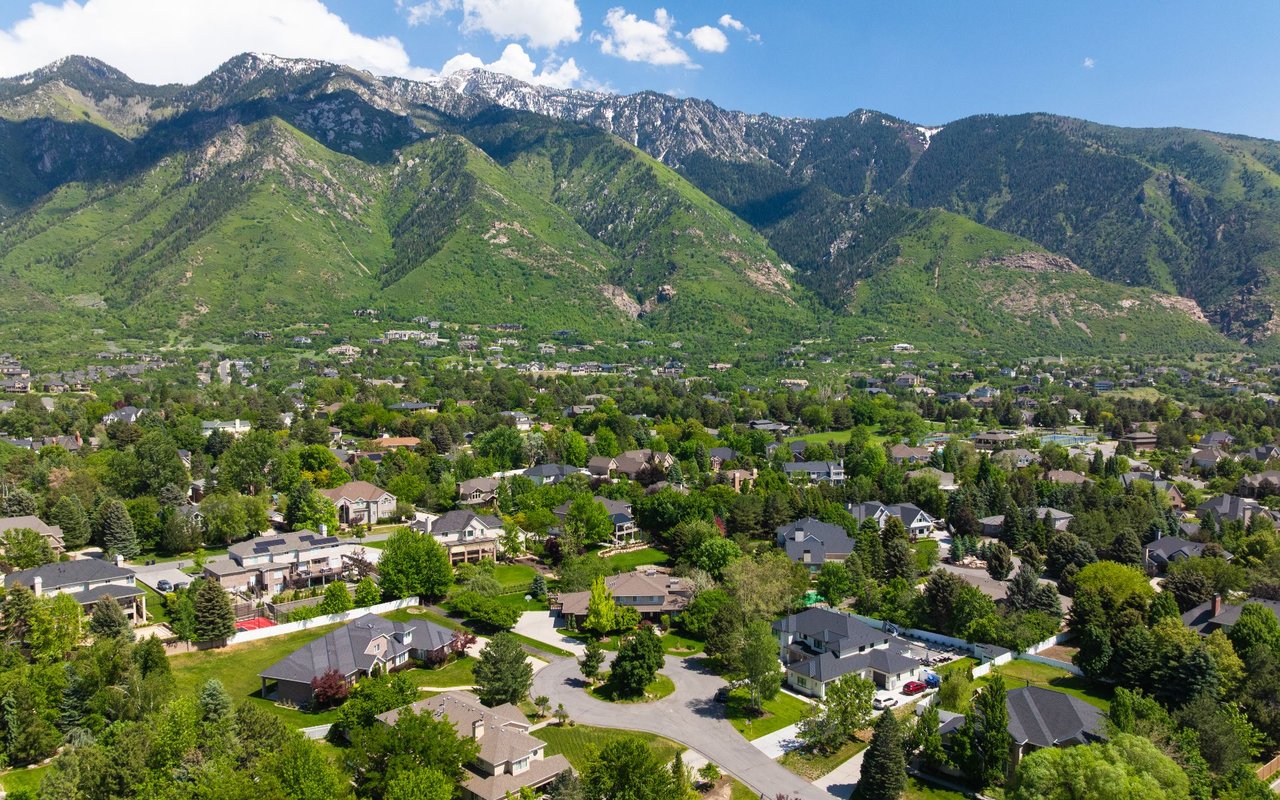
Salt Lake’s East Bench neighborhood stretches along the Wasatch foothills and is one of the most prestigious addresses in the valley. Known for panoramic views of the city and surrounding mountains, the East Bench offers quick access to outdoor recreation, including nearby Emigration Canyon and Millcreek Canyon. Architectural styles vary from historic mid-century moderns to expansive contemporary hillside estates designed to maximize views. Residents enjoy proximity to the University of Utah, Red Butte Garden, and cultural landmarks like the Natural History Museum. Families appreciate the highly regarded schools and quiet, tree-lined streets, while professionals benefit from a short 20-minute drive to the Salt Lake International Airport. The closest ski resorts—Snowbird, Alta, Brighton, and Solitude—are less than 40 minutes away, making it an ideal location for those who value both city amenities and mountain access. Homes for sale in Salt Lake’s East Bench combine refinement, convenience, and a true connection to nature.
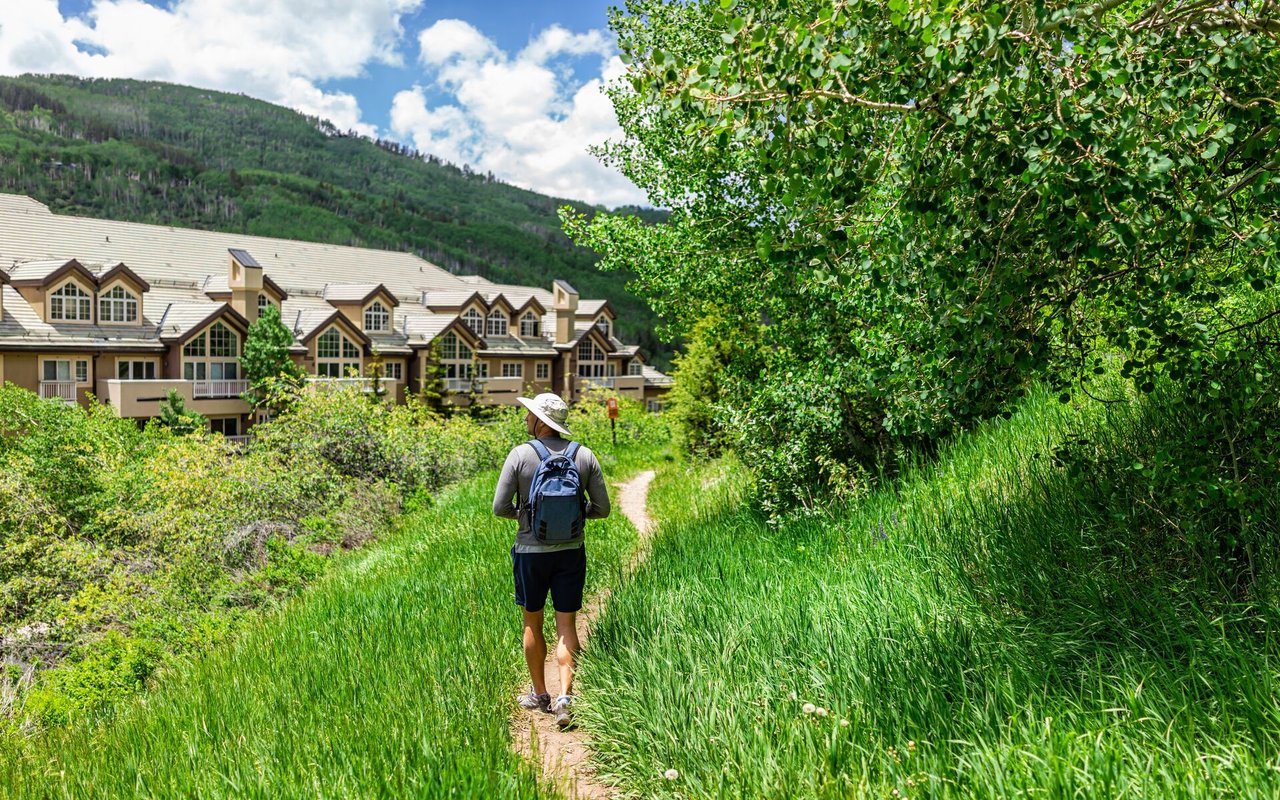
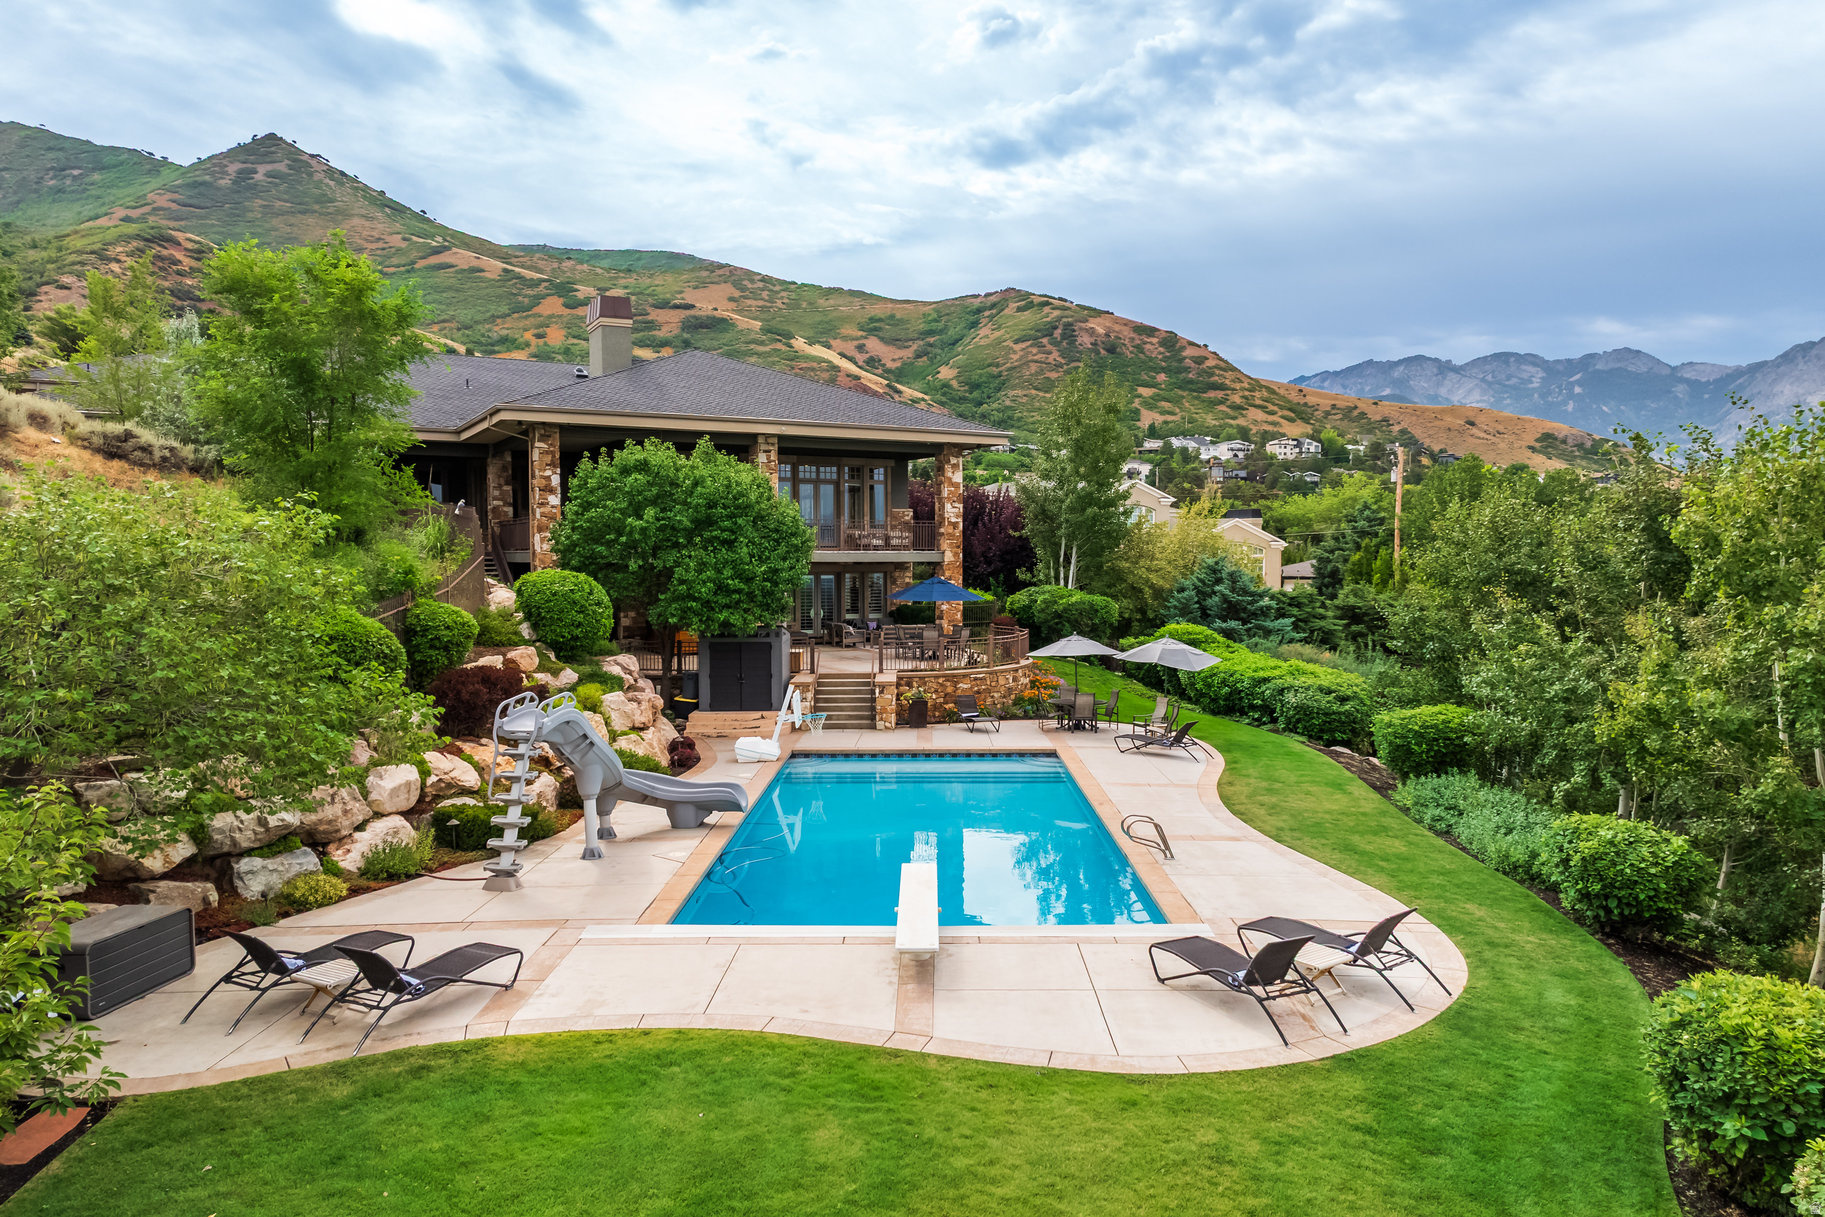
Living on Salt Lake City’s East Bench
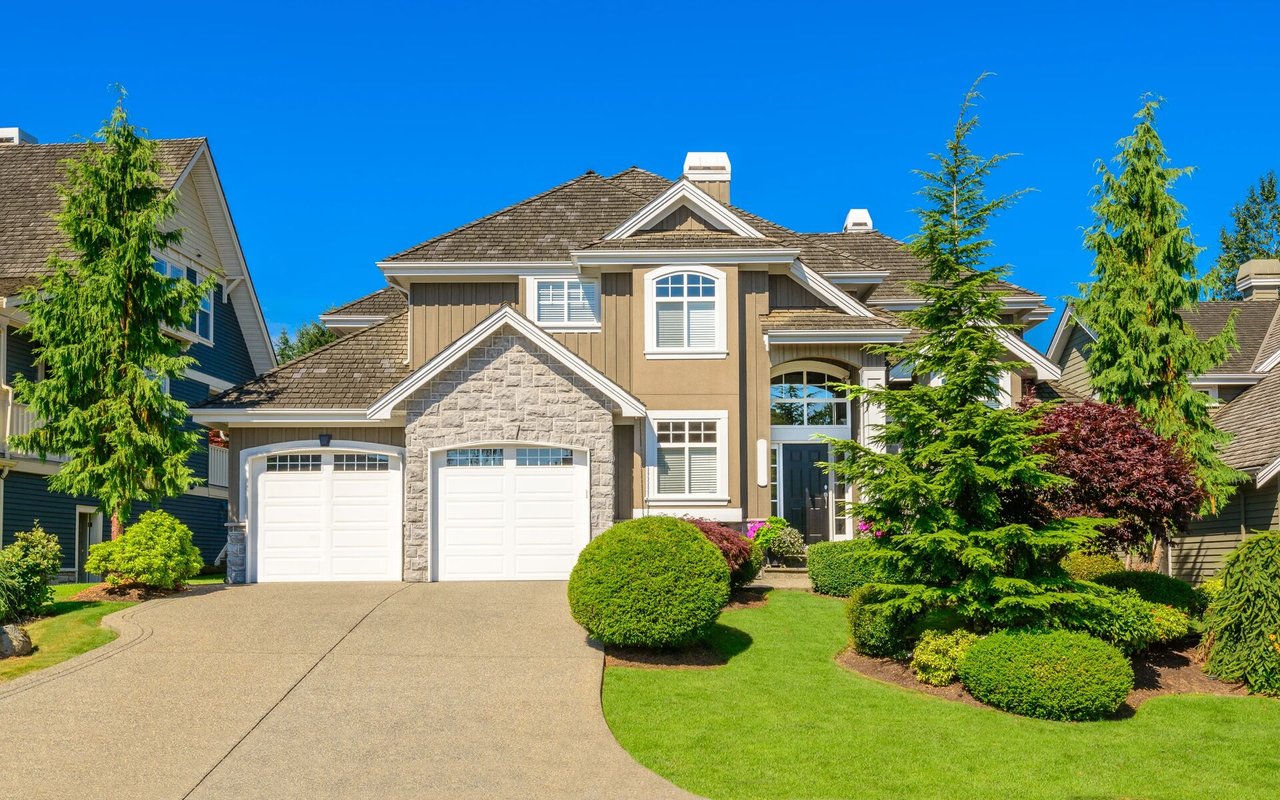
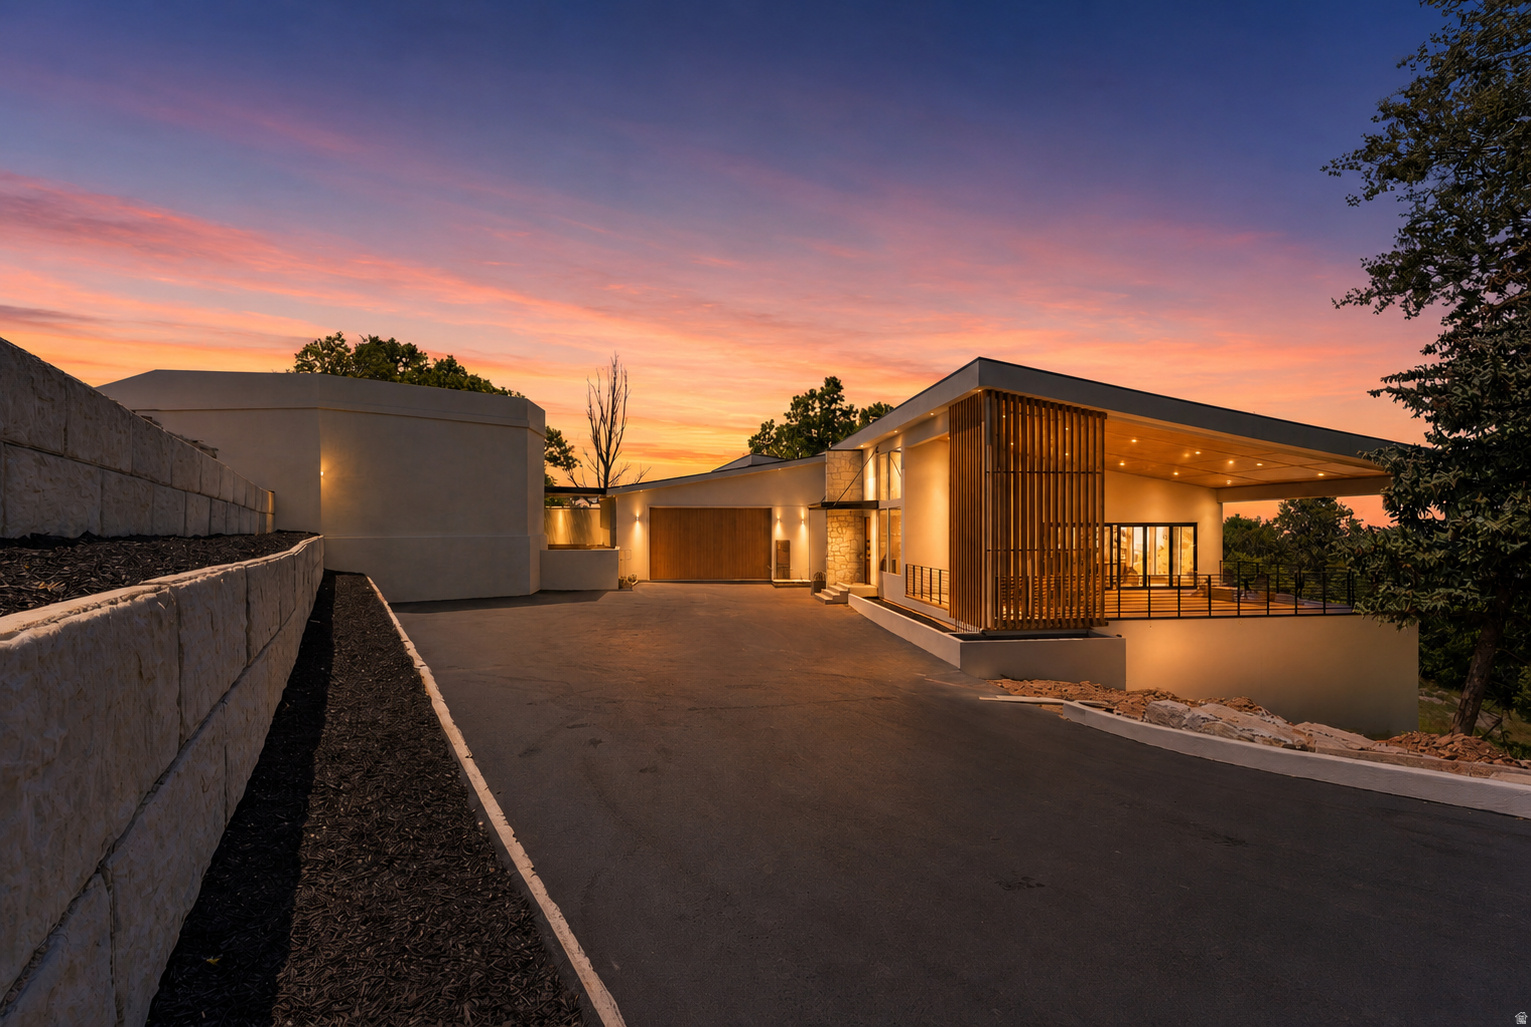
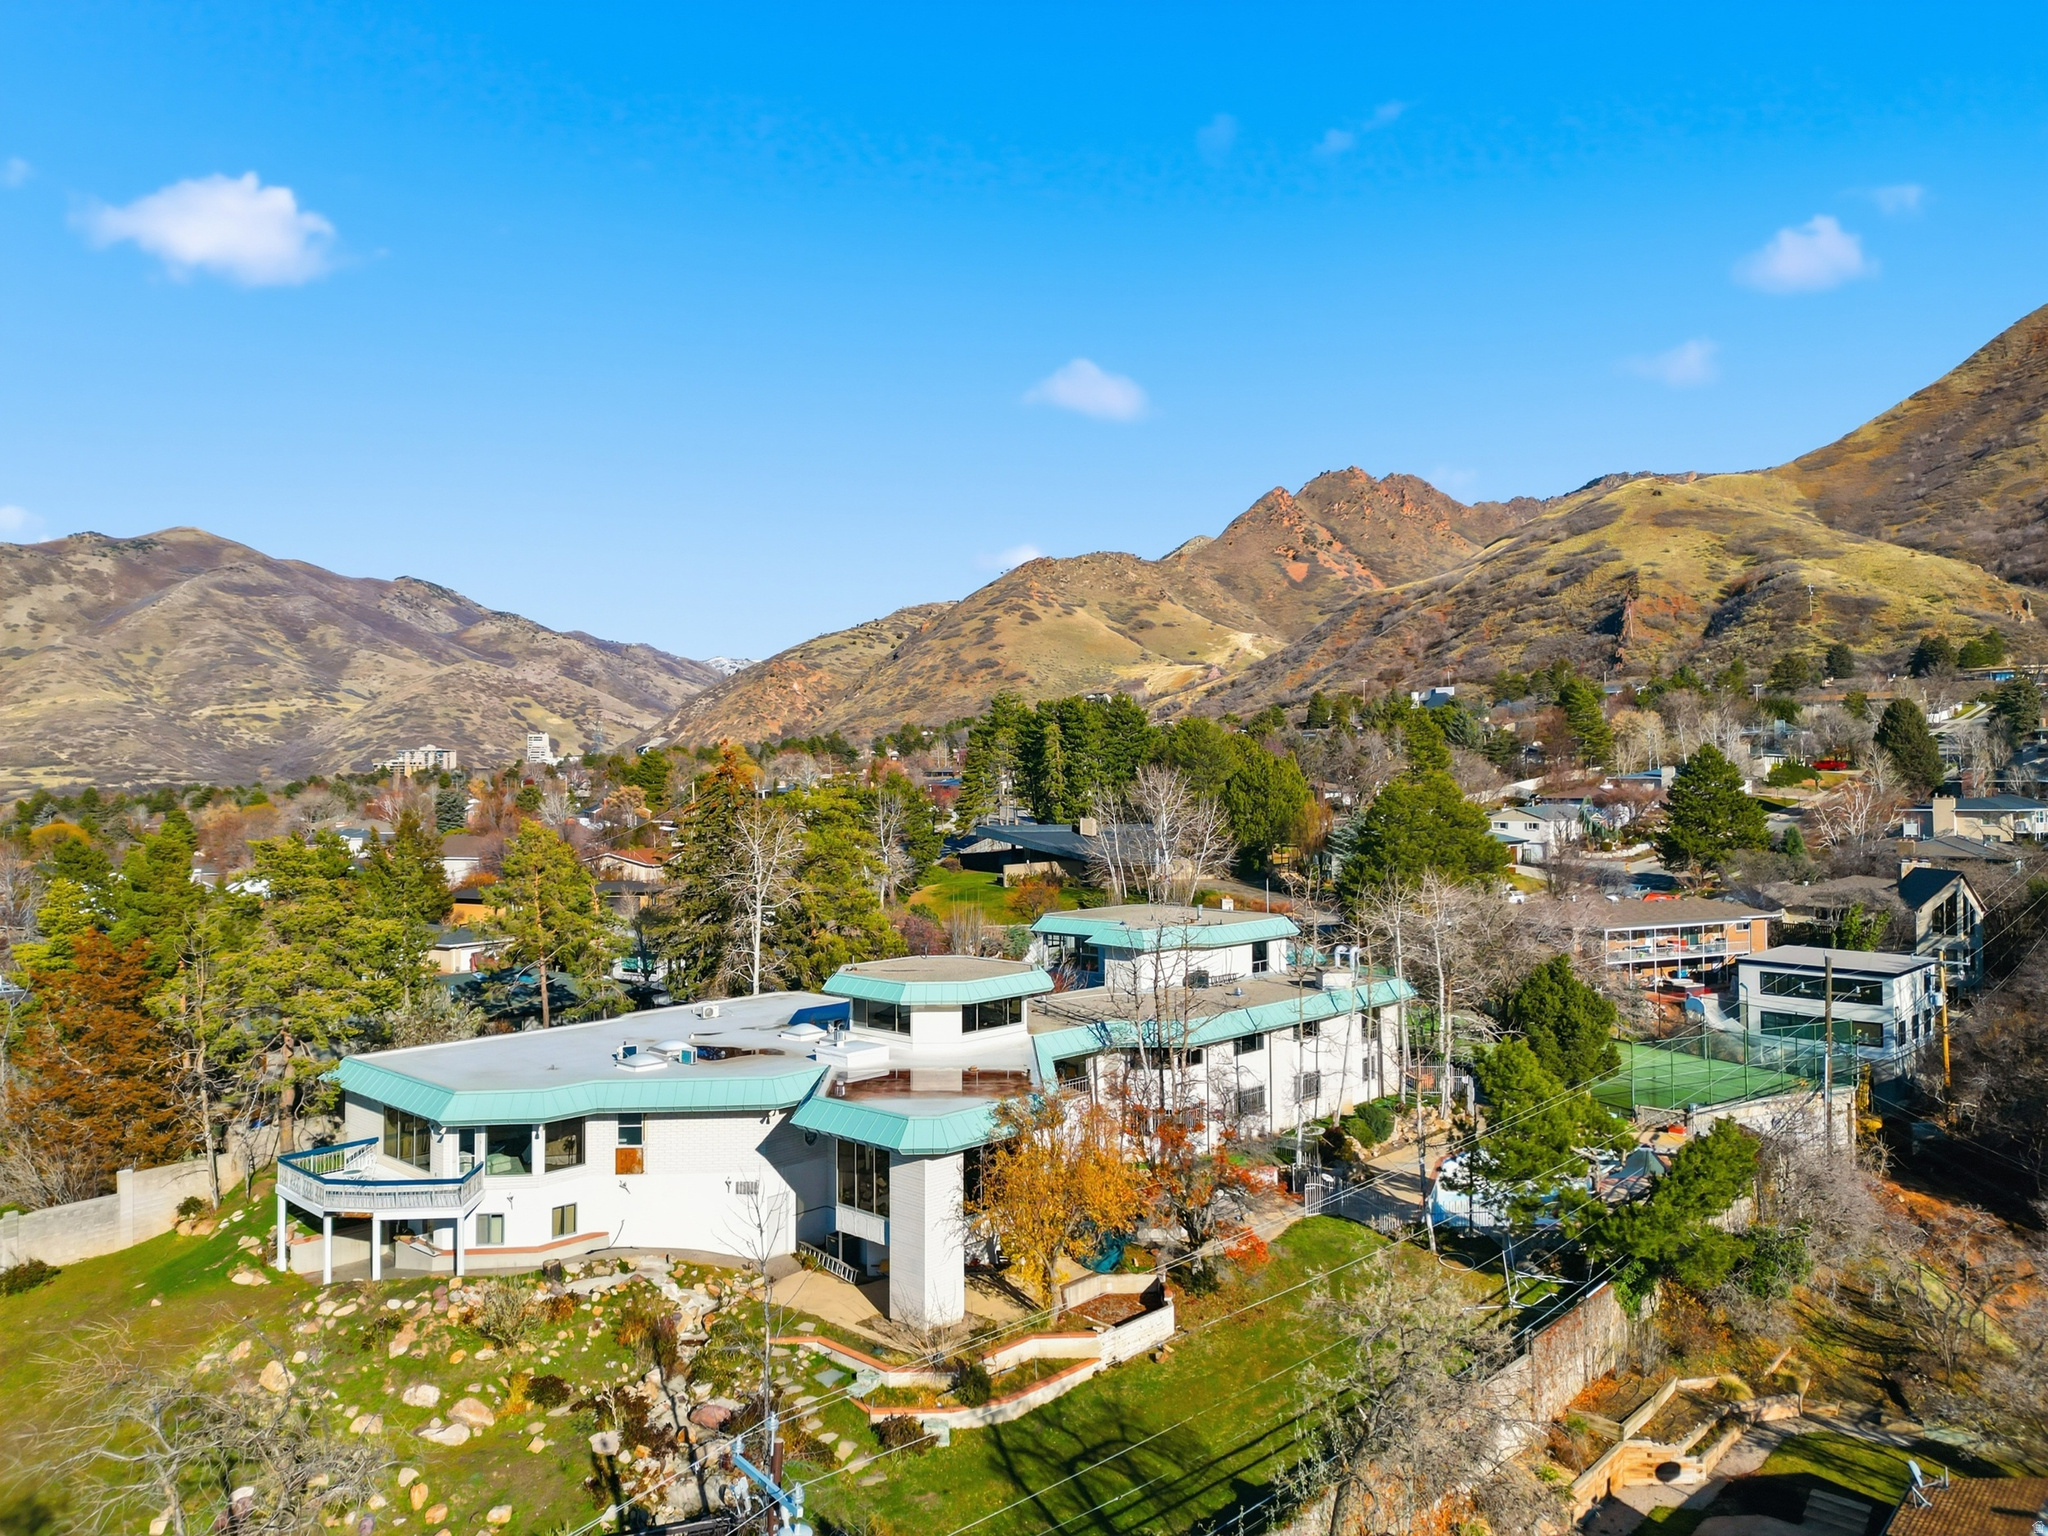
Real Estate & Architectural Styles in the East Bench
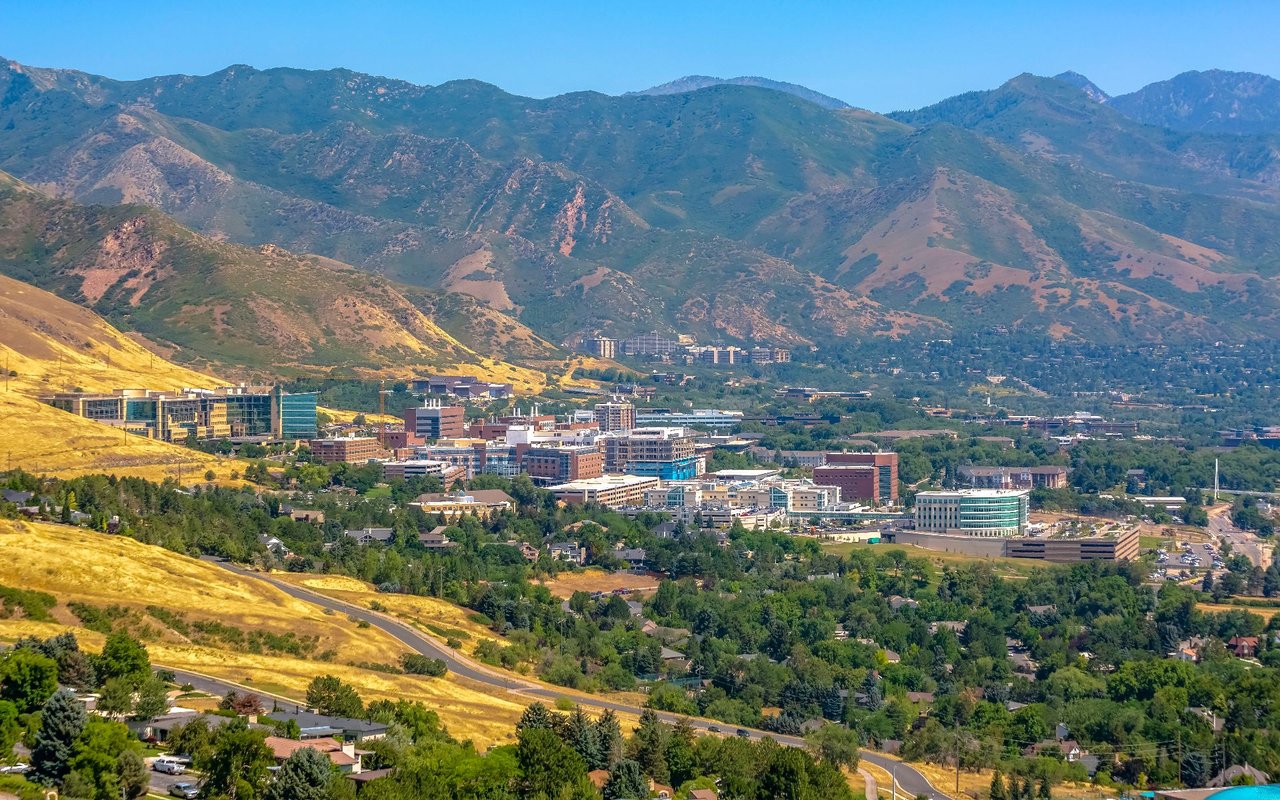
Nearby Parks, Culture, and the University of Utah