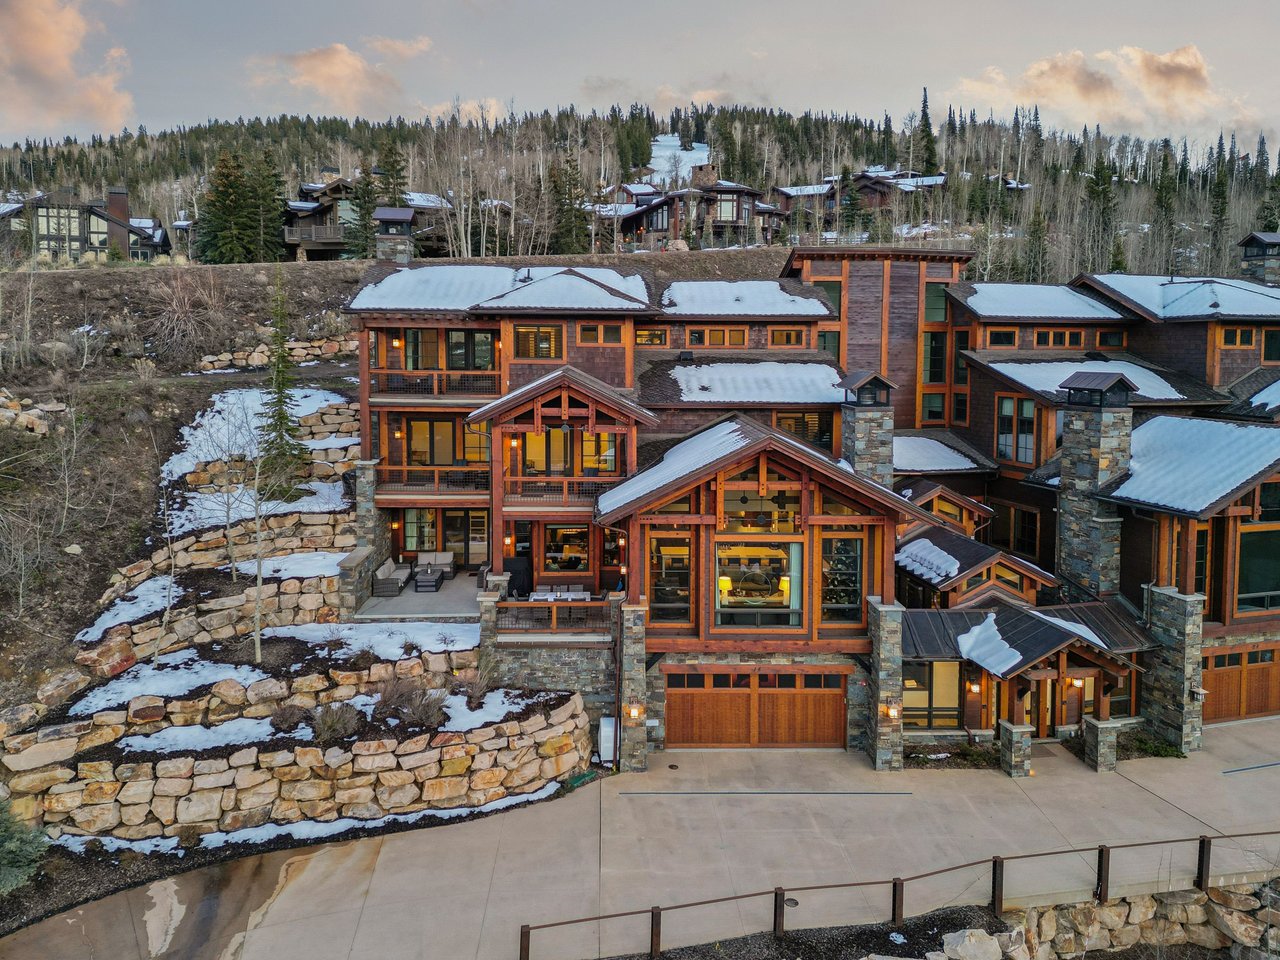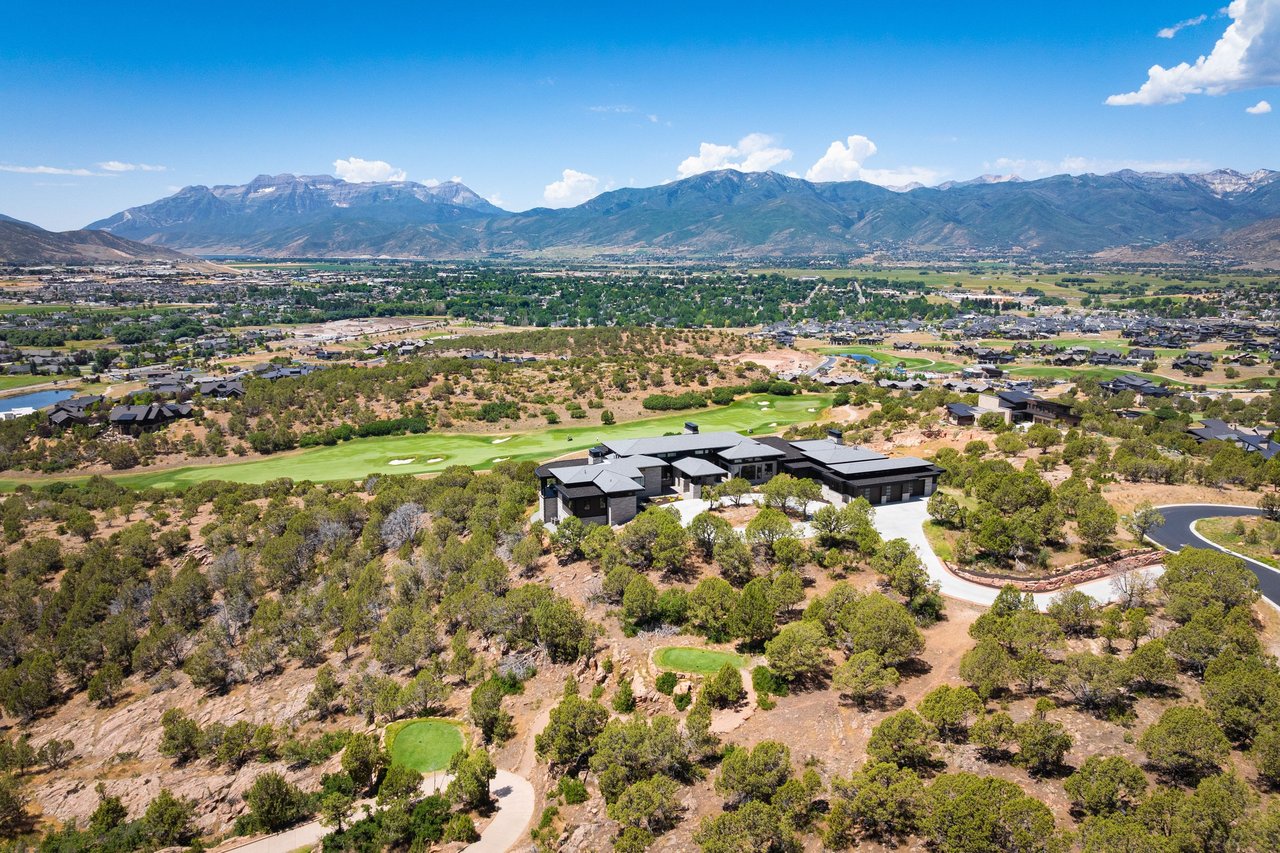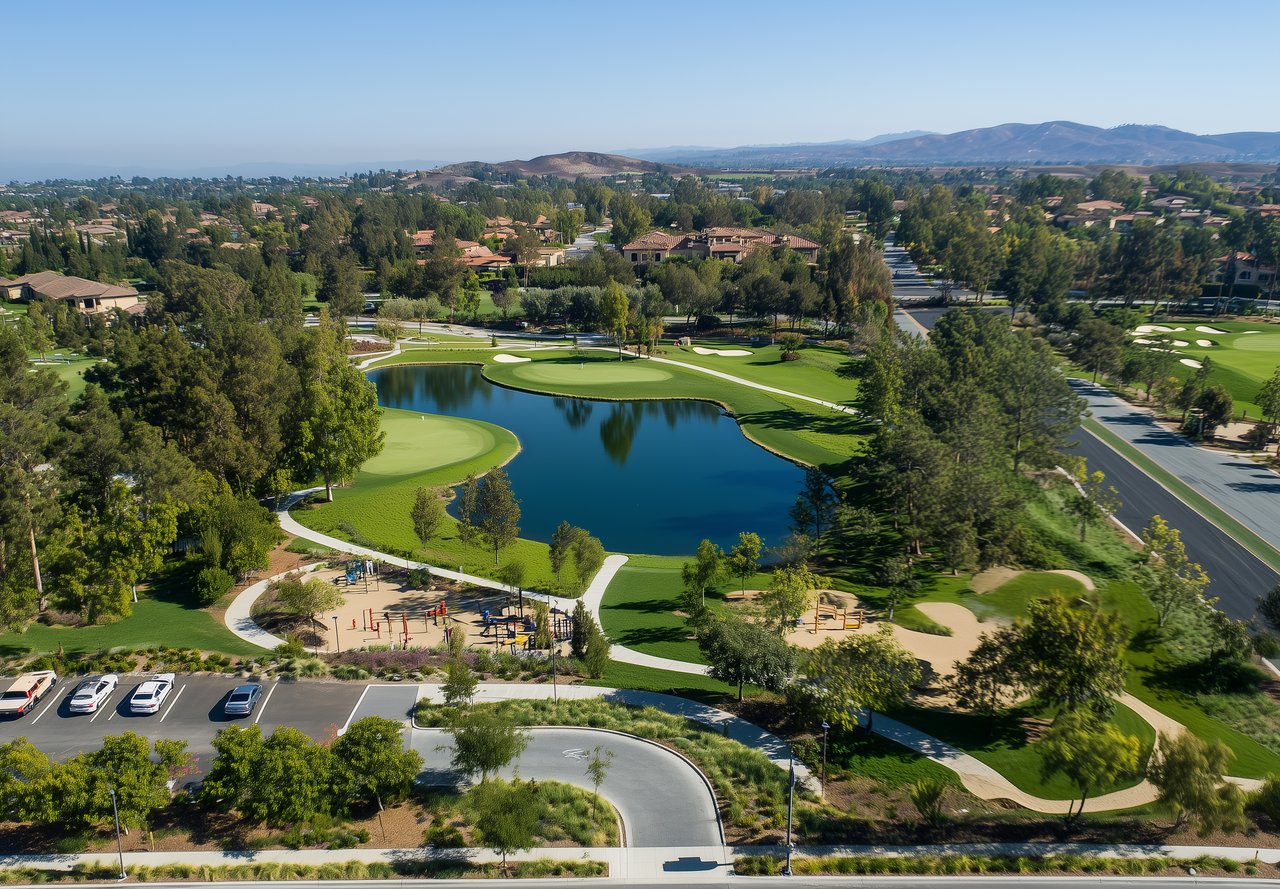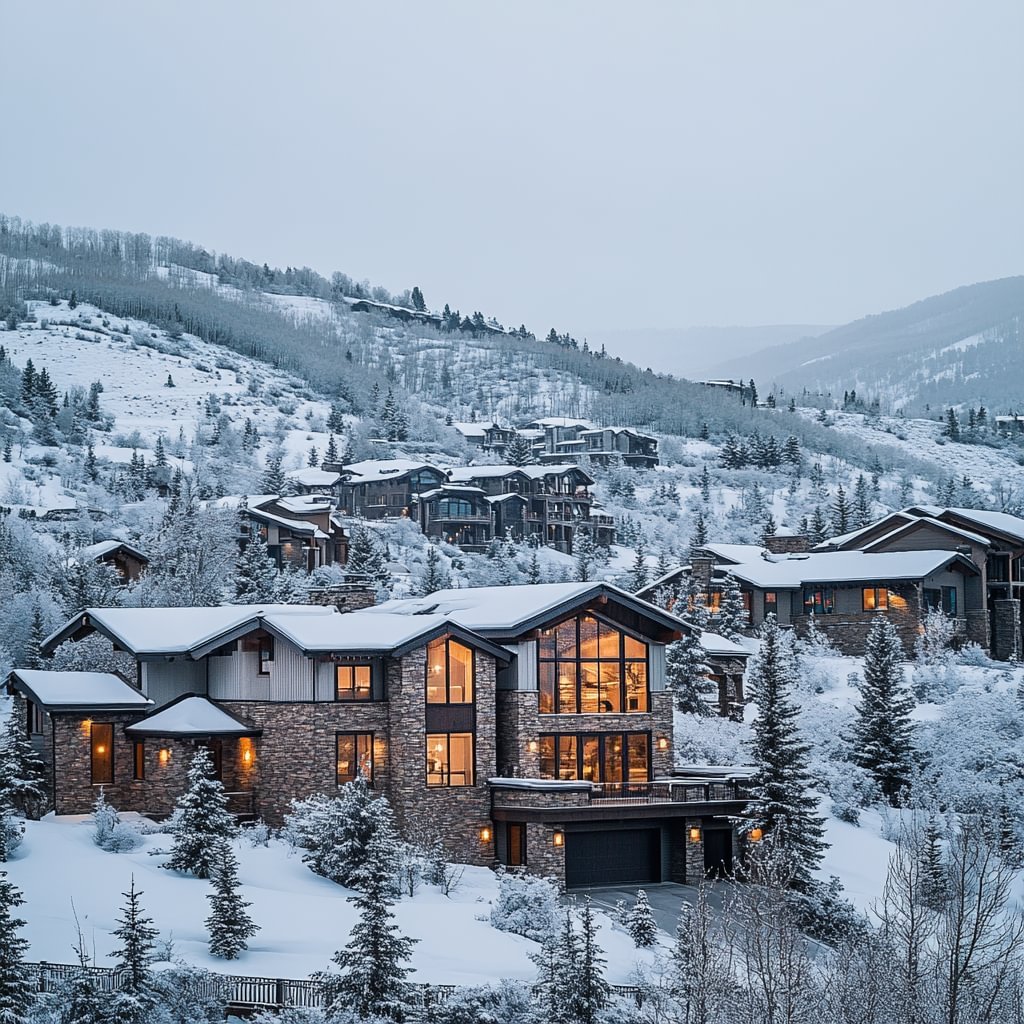
Single-family homes hold steady, condominiums stabilize after last year's new-construction wave, and land sales explode across every corner of the Wasatch Back.
The second quarter of 2026 gave the greater Park City real estate market its clearest signal yet: this is a market finding a new equilibrium — and what that equilibrium looks like depends entirely on where you're standing. Combined across single-family homes, condominiums, and land, the market generated $1.358 billion in sales during Q2 2026, a 7% increase over Q2 2025, on 10% more transactions. Zoom out to the rolling 12-month view and the picture is even more reassuring: total volume is up 9% year-over-year to $5.73 billion.
Here's how each property type performed, and what it means for buyers and sellers in Park City/Snyderville Basin, Heber Valley, and Kamas Valley.
Single-Family Homes: Steady, With Pockets of Real Strength
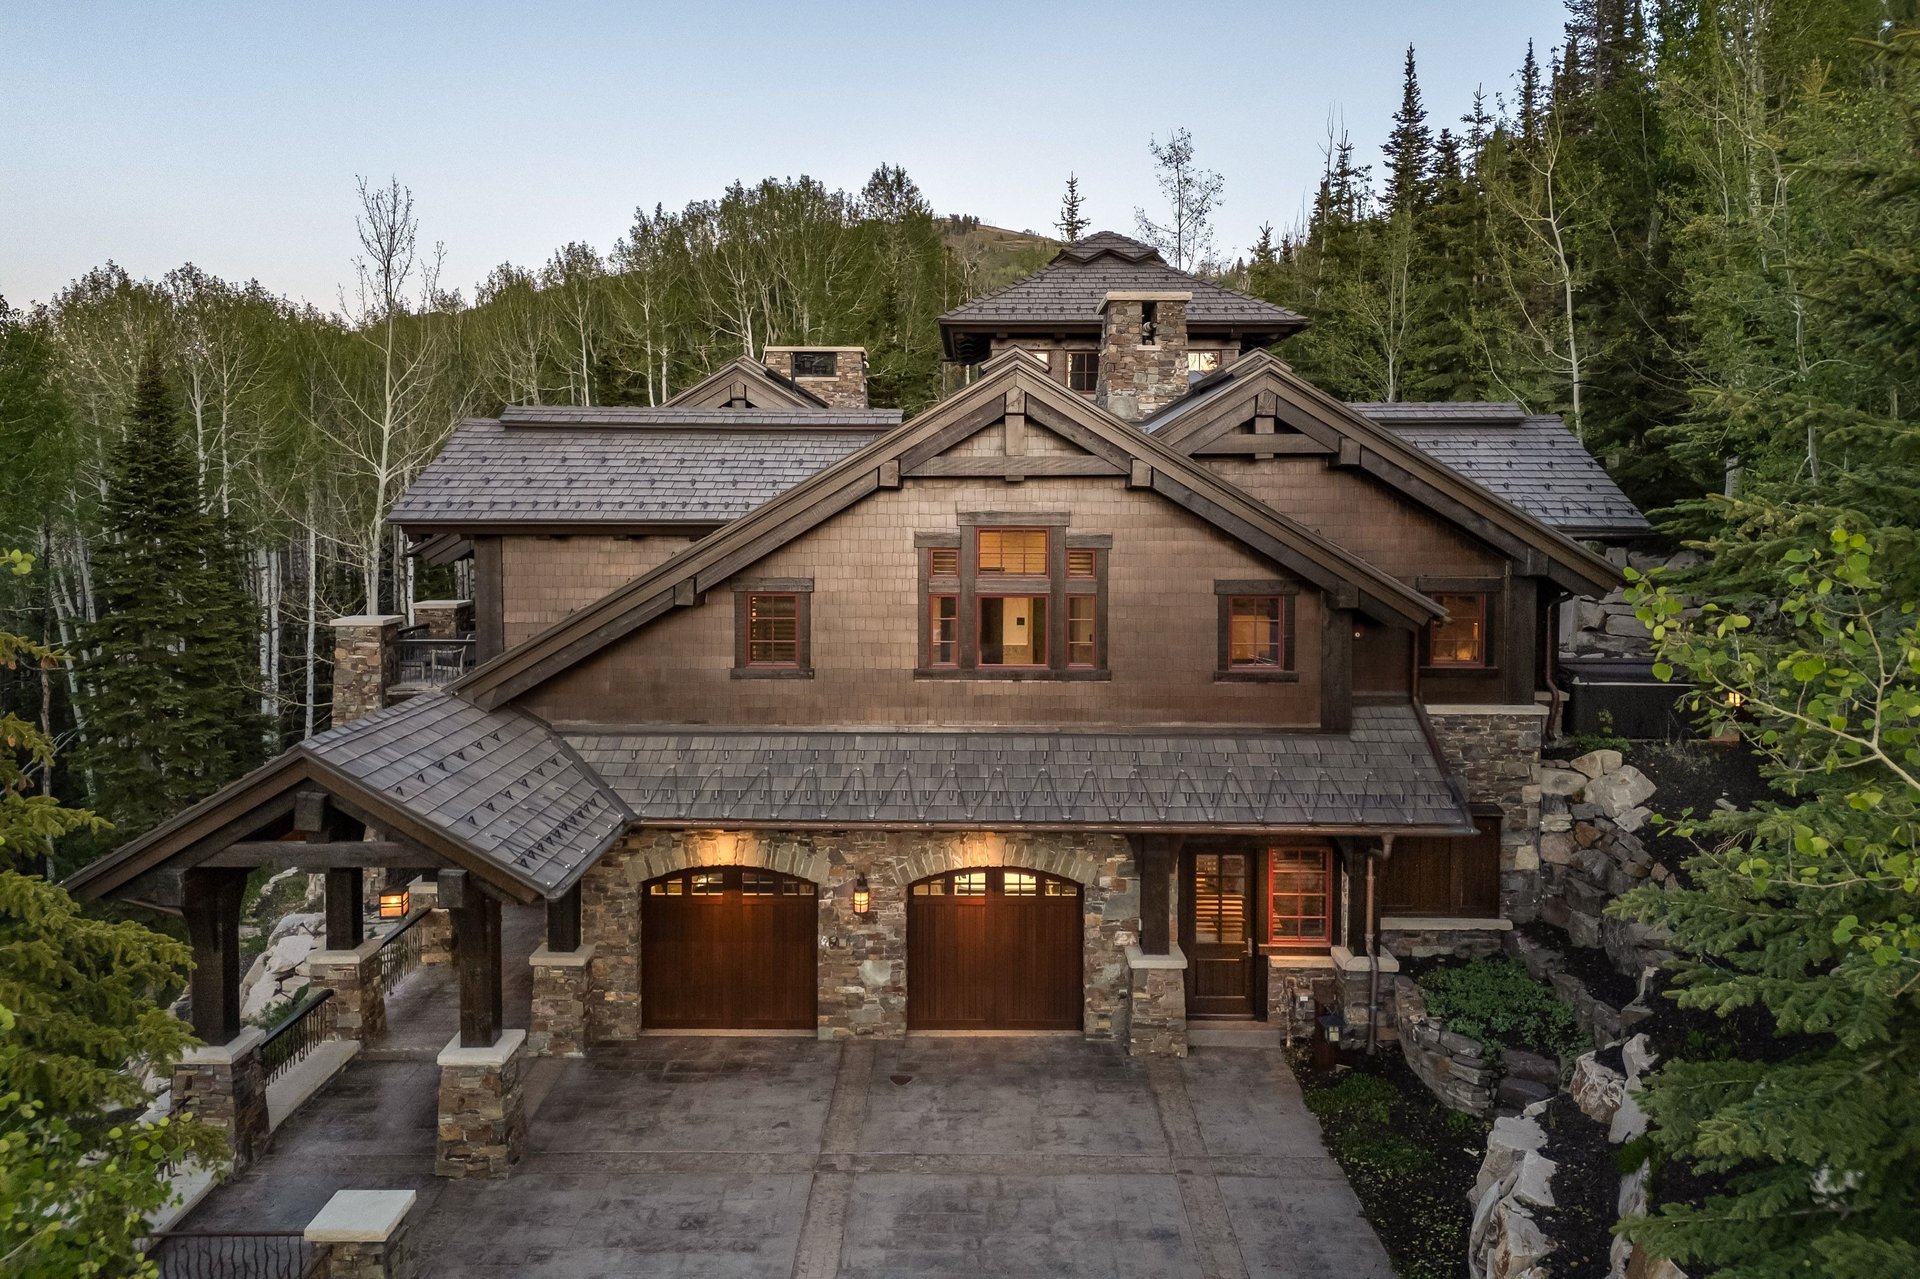
Single-family homes remained the market's anchor in Q2 2026, with 319 transactions generating $840.9 million — up 6% in units and 2% in volume year-over-year. The rolling 12-month numbers show even more strength: 1,341 sales totaling $3.6 billion, up 8% in units and 15% in volume, with the median price across the full MLS area rising 10% to $1.7 million.
Park City / Snyderville Basin This region told two different stories in Q2. Park City proper had a genuine spring rally — transactions jumped 21% (24 to 29 sales) and volume surged 35% to $148.8 million. Park Meadows led the charge with 10 sales at a $3.95 million median, and Empire Pass posted a single, headline-grabbing $25 million sale. Snyderville Basin, on the other hand, cooled — 77 sales generating $289.2 million, down 8% in units and 19% in volume from Q2 2025. But luxury enclaves bucked that trend: Glenwild volume rose 110% to a $8.33 million median, and while Promontory saw fewer transactions (17, down 32%), its median price jumped 28% to $6.6 million — fewer deals, higher quality.
Heber Valley Heber Valley posted 97 sales, essentially flat at +2%, though volume dipped 10% to $147.2 million — a function of shifting product mix rather than falling prices. Red Ledges remained the area's prestige anchor, with 12 sales averaging $3.76 million, up 38%. The rolling 12-month median of $1.05 million (up 1%) confirms overall price stability.
Kamas Valley Kamas Valley was one of the quarter's standout stories: 22 single-family sales generated $45.2 million, a 70% volume increase, with average price up 47% to $2.05 million. The Oakley & Weber Canyon sub-area drove much of this, posting a 607% volume jump. This corridor is increasingly attracting buyers chasing the mountain lifestyle at a fraction of Park City proper's price tag.
Condominiums: Finding a Floor
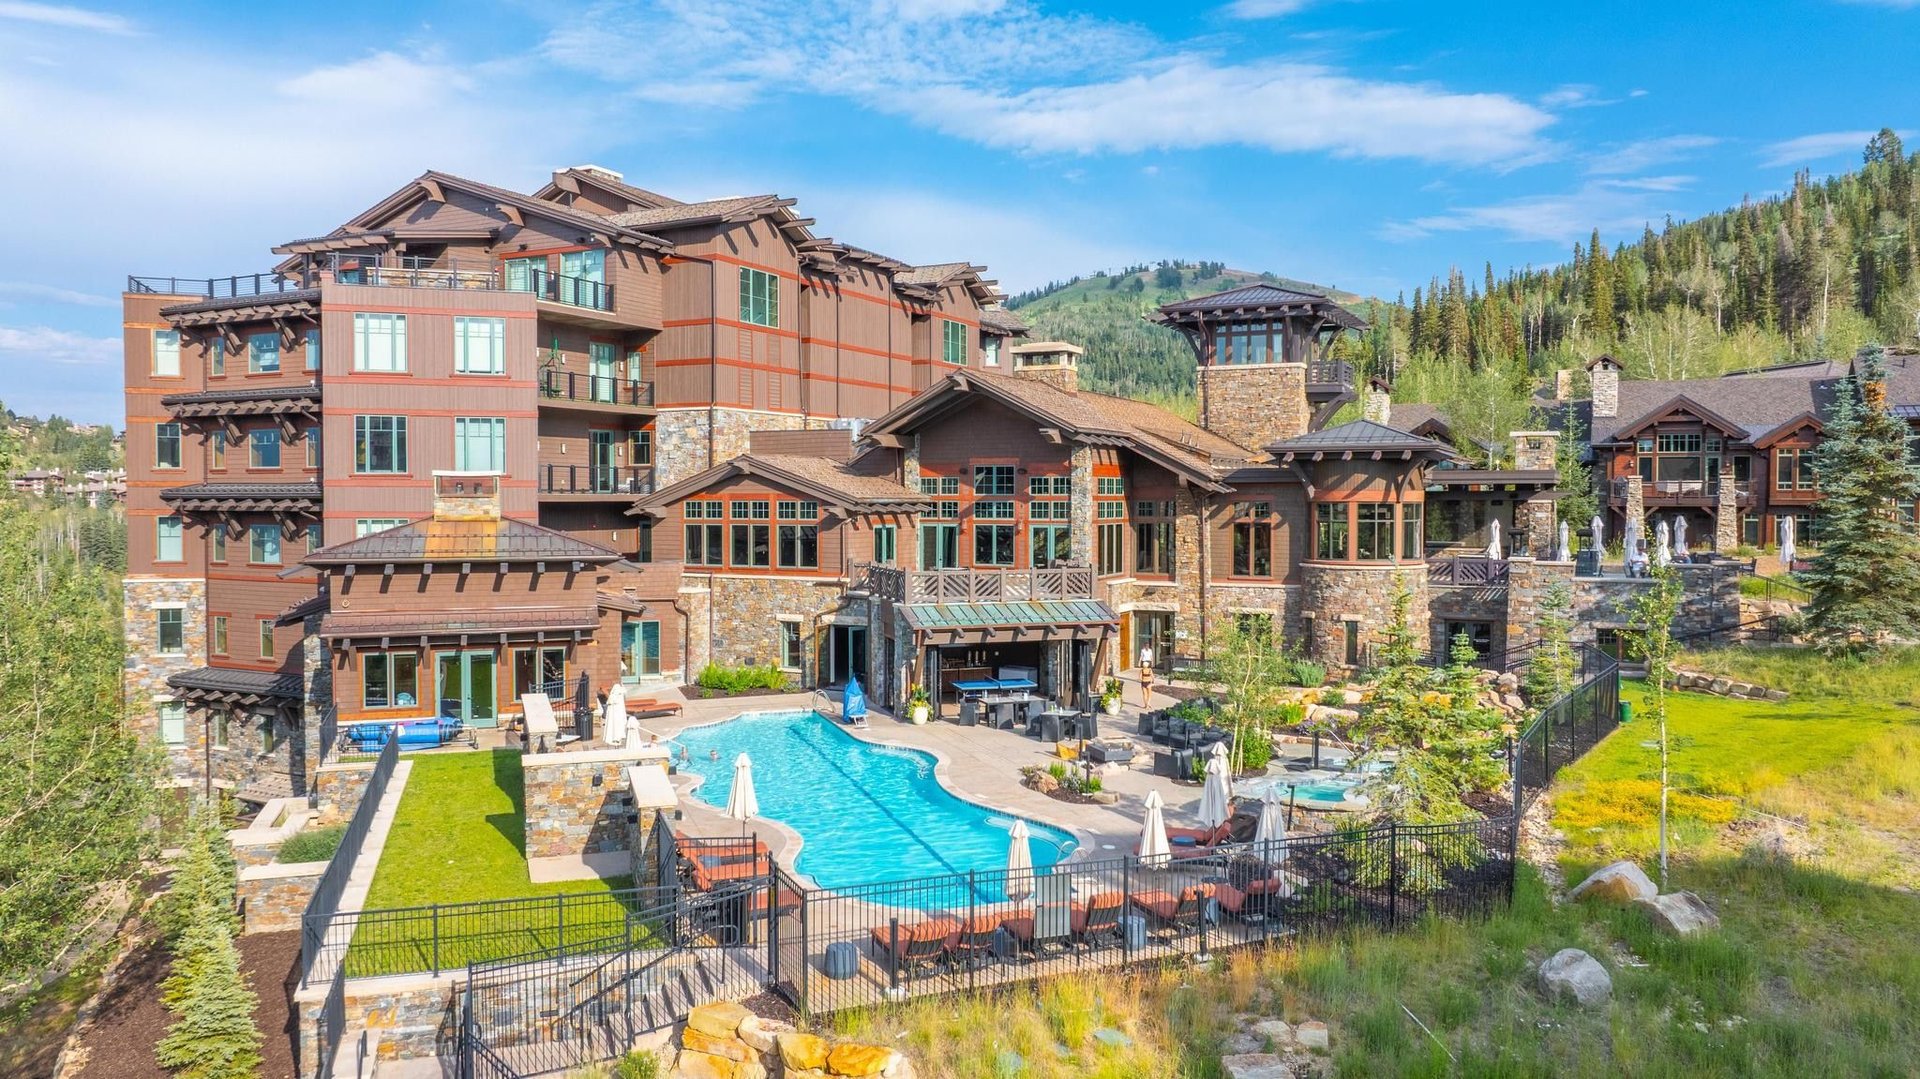
The most important condo headline for Q2 2026 is what didn't happen — the market didn't fall apart. With 203 transactions generating $335.4 million MLS-wide (essentially flat versus Q2 2025), condos appear to have found solid footing after a sharp Q1 pullback.
Park City / Snyderville Basin Park City Limits continues working through a post-new-construction supply hangover, with condo transactions down 11% to 47 sales. Still, the median condo price here rose 24% year-over-year to $2.3 million — proof that what is selling commands a strong premium. Snyderville Basin was the quarter's condo outperformer: 58 sales generated $100.1 million, a 33% volume jump driven largely by Canyons Village, where the average condo price rose 50% to $2.45 million.
Heber Valley Heber Valley condos saw a sharp pullback — just 12 sales at $7.8 million, down 64% in units and 62% in volume. Much of this traces to Heber North, which logged 25 sales in Q2 2025 and zero in Q2 2026 after a builder exited the local MLS — a supply-timing anomaly worth watching rather than a demand story.
Kamas Valley Kamas Valley condos are a genuinely new data point for this submarket: 8 sales generated $3.8 million this quarter, with a median price of $485,000, reflecting new inventory entering an area that historically hasn't had much condo product at all.
Land: The Quarter's Breakout Performer
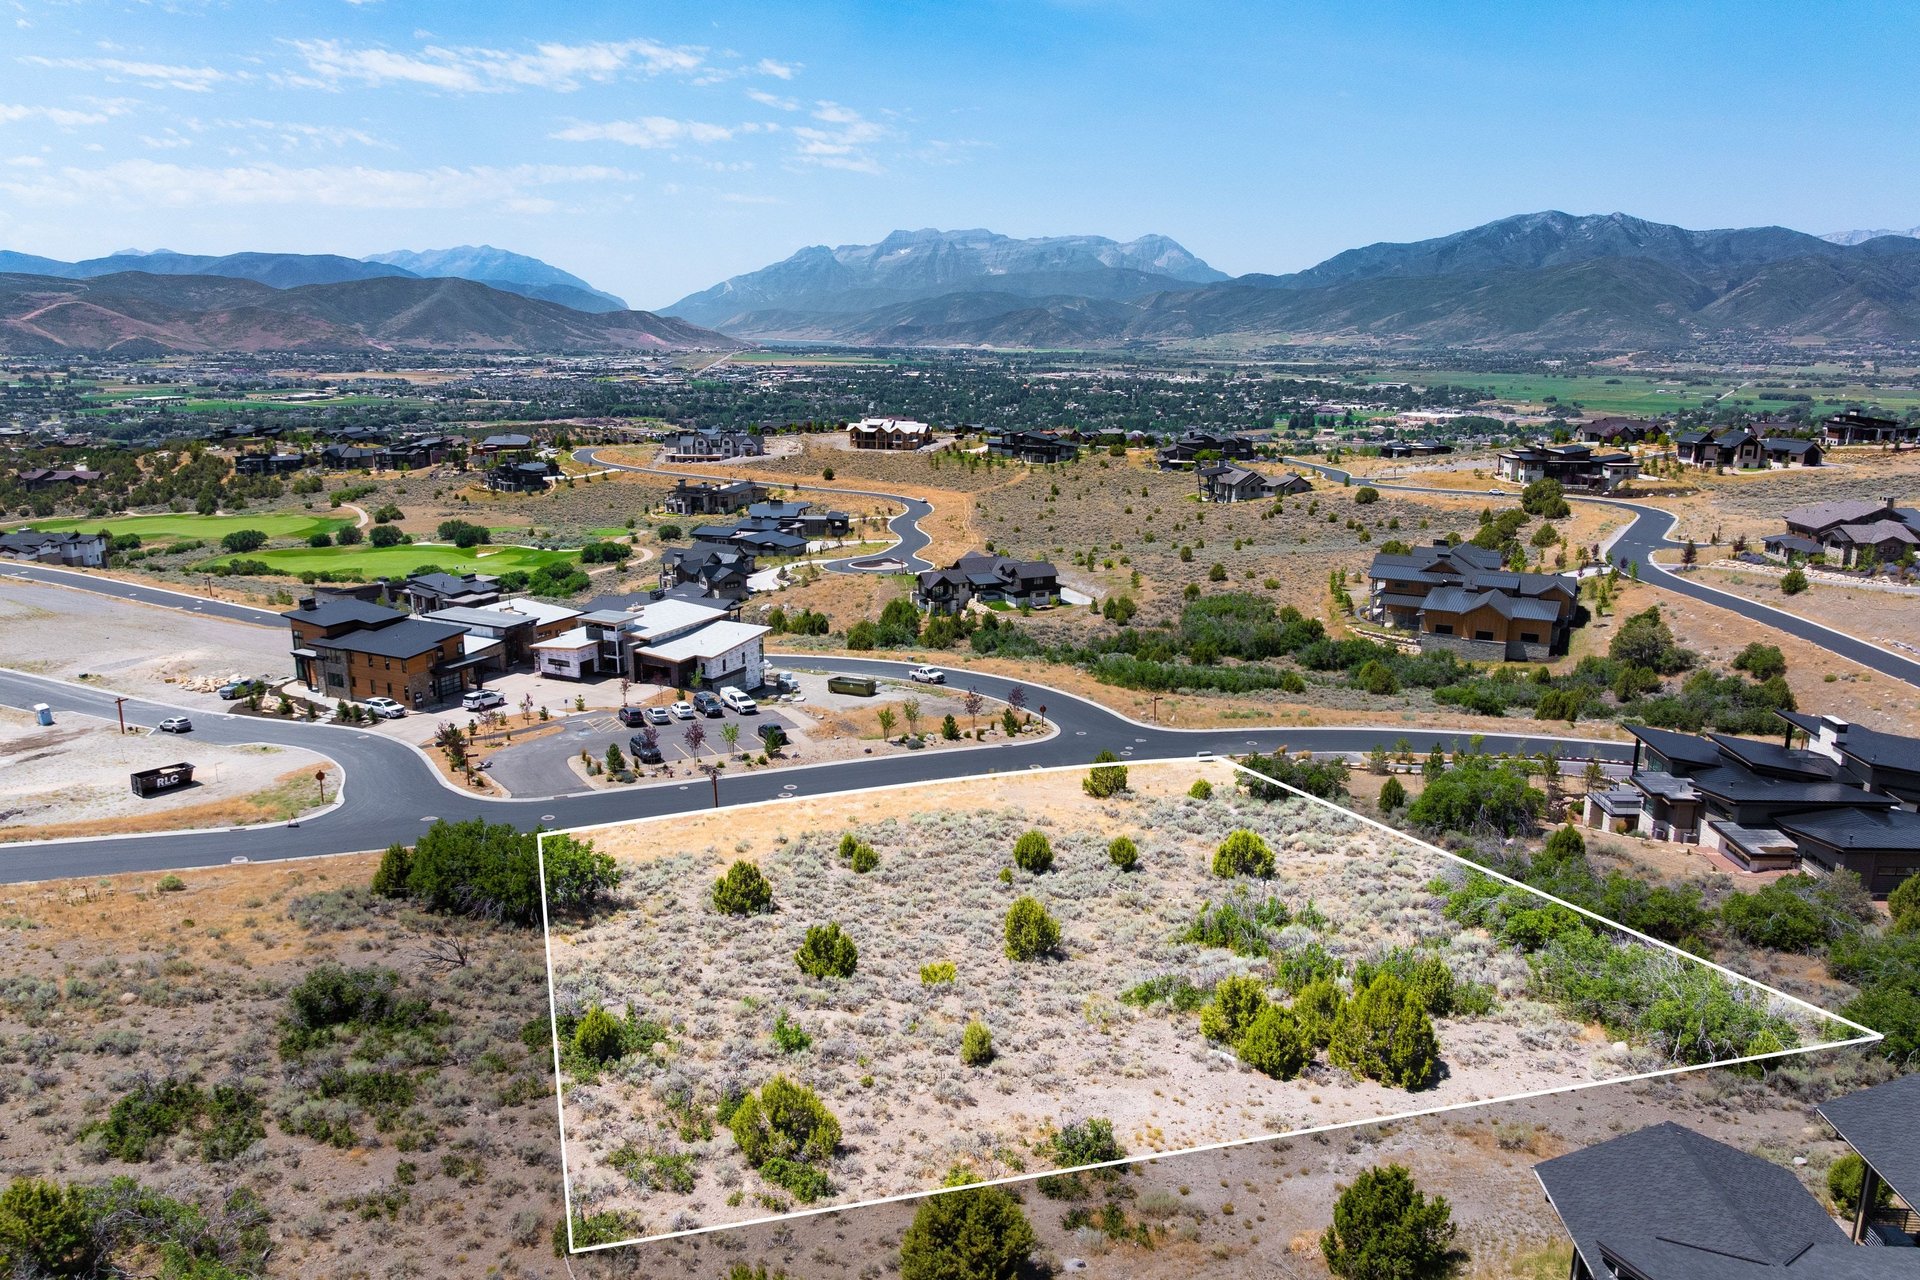
If one story defines Q2 2026, it's land. Transactions surged 46% and volume jumped a striking 74% to $181.3 million — with every major geographic area participating. Historically, land activity leads the broader housing market by 12–24 months, so this surge is a meaningfully bullish signal for where Park City real estate may be headed in 2027–2028.
Park City / Snyderville Basin Park City Limits land sales held flat at 2 transactions, with a median price of $2.84 million. Snyderville Basin, by contrast, exploded — 32 sales generated $44.8 million, up 167% in units and 174% in volume, with the median lot price rising 120% to $1.475 million. Promontory led the way with a 615% volume surge in golf-accessible lots, and even exclusive Glenwild saw 5 land sales versus zero a year ago.
Heber Valley Heber Valley land was comparatively steady — 22 sales at $15.3 million, up modestly in both units (+5%) and volume (+4%), with a $487,000 median.
Kamas Valley Kamas Valley land is in early-stage price discovery, posting 14 sales at $15.3 million — a 75% jump in units and a remarkable 254% surge in volume, with the median price up 201% to $812,500. Buyers are increasingly looking beyond Park City proper for land acquisition opportunities.
The Bigger Picture
Taken together, the data points to a market that's healthy but increasingly selective. Well-capitalized buyers continue to pay a premium for the right property — particularly new construction, ski-access homes, and land in core locations — while more average product is taking longer to sell and requiring more price adjustments. Elevated mortgage rates and trade-policy uncertainty remain headwinds for rate-sensitive buyers, while the luxury, cash-heavy segment stays comparatively insulated.
The fundamental case for Park City real estate — scarcity, lifestyle, and a long track record of appreciation — remains firmly intact.
Curious how these trends apply to your specific neighborhood or property? Reach out to the VUE Christie's team for a personalized market analysis.
Source: Park City Board of REALTORS® / Park City Multiple Listing Service, Q2 2026 Market Report. Data is preliminary and subject to revision as late-reporting transactions are recorded.